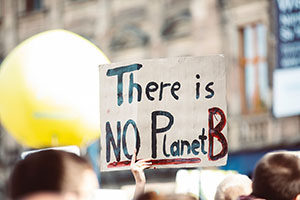
Representatives from Somerville’s Climate Forward Ambassador program recently held their kickoff webinar event to inform the public about climate change issues.
By Max Eidelman
Somerville’s Climate Forward Ambassador program hosted its first of four scheduled webinars last Thursday. Hannah Payne and Oliver Sellers-Garcia of the city’s Office of Sustainability and Environment led the webinar, which ended with a Q&A session.
As stated on the city’s website, “The Somerville Climate Forward Ambassador program is designed to empower Somerville residents to take action on climate change in their community.” This webinar provided a summary of the current state of climate change’s effect on the city and studies of what can be done in response to it. The upcoming webinars will address the details of specific efforts that can be made to address the threat of climate change.
Payne and Sellers-Garcia displayed a variety of charts and metrics to quantify the effect of climate change. One of the first was a graph charting the rise in carbon dioxide levels over the past century up to the time of the meeting, at which point it was at 416 PPM. This means for every million particles of air, there were 416 particles of carbon dioxide. Payne said this rise in levels can “only be explained by human action,” as opposed to natural causes.
Payne referred to a clever visual of a bucket being filled with water to describe the concept of a “carbon budget.” The concept is to limit the total amount of carbon being emitted in the atmosphere, i.e., how much carbon can we “spend.” The graphic depicts water filling a bucket, which is intended to reflect the rising level of carbon emissions filling the atmosphere. If the bucket overflows, the carbon budget has been surpassed.
Perhaps it goes without saying that we do not want to see the bucket overflow, but the numbers predict that the bucket will overflow in ten years based on current patterns. Despite the pessimistic outlook, though, Payne reminded the attendees that at least “we know what the problem is, and we have the tools to fix it.” It’s a matter of people actually acting upon the information.
Sellers-Garcia presented a chart that outlined specific areas of the city’s infrastructure in terms of the volume of their emissions. The chart shows that about 2/3 of city’s total emissions come from buildings (e.g., heating and electric utilities), 1/3 from transportation within the city, and a tiny portion from waste.
With this information as context, Sellers-Garcia presented additional charts that map the potential effects different courses of action might have on impacting climate change within the city. The model suggests that switching the means of fuel in the transportation arena could be the most effective means of attaining carbon neutrality in the city.
Among possible realities that the city may confront if efforts aren’t made to curb emissions is the potential for the region to see perhaps 90 days of weather over 90 degrees per year by 2070. Being New Englanders, we may at first laugh at something like this being considered a bad thing, but it truly is a testament to just how drastic a change many of us can possibly experience in our lifetime.
While most people in our area understand the reality of global warming and its threat, the webinar offered numbers, diagrams, and all the science that ought to incentivize folks to actively try to curb their impact on emissions.
There are three more of these webinars scheduled that are intended to address solutions and the relation between public health and the climate. They are available to the public and can be attended via Zoom. For further information about how to attend the webinar or for additional details about environmental studies being done in Somerville, you may visit the Ambassador’s page on the city’s website at https://www.somervillema.gov/departments/programs/climate-forward-ambassadors.


Reader Comments