Pages
Stay In Touch
More
© 2025 The Somerville Times. All rights reserved.

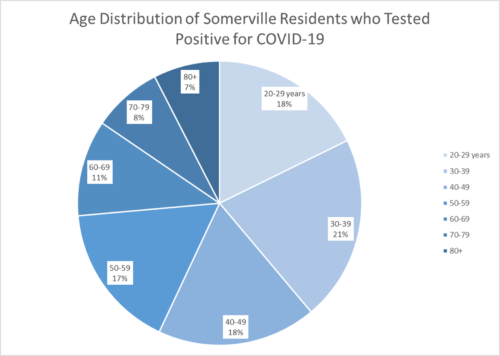
The city has a Somerville-specific age breakdown of who in our community has tested positive so far for #coronavirus. Because our city has a large population of younger adults, we are seeing higher incidences of the disease in younger adults than in other communities. The 30-39 age bracket has the largest number of cases, accounting for 21% of the community. The 20-20 and 40-49 brackets follow with 18% each.
It is important to remember, you can contract and spread this disease no matter what your age is. No one is immune and serious cases can occur at any age.


This absolute percentages are interesting as a snapshot of the community experience, and a useful reminder that anyone can get it (though the chart shows no incidence in the under-20 age group — is that the case?). I’d like to see the data normalized for the number of people in each group. In other words, what percentage of Somerville 20-29 year olds tested positive?
The absence of data about the age distribution of Somerville residents leads the unwary to some very incorrect conclusions about age-related risk. The published chart amplifies the likelihood of those erroneous conclusions.
According to the US Census Bureau, Somerville had a total of 81,562 residents in 2018. Interpolating those statistics to match the age bins of the above data yields:
<19: 14,681 (18.0%)
20-29: 17,699 (21.7)
30-39: 18,270 (22.4)
40-49: 11,908 (14.6)
50-59: 6,933 ( 8.5)
60-64: 3,507 ( 4.3)
65+: 8,564 (10.5)
Total: 81,562 (100.0%)
The current data on the Somerville town website reports 332 cases reported in Somerville as of 17-Apr-2020.
Applying the above shares to those cases yields the following infection counts by age:
20-29: 60 (18%)
30-39: 70 (21)
40-49: 60 (18)
50-59: 56 (17)
60-64: 16 ( 4.9)
65+: 70 (21.1)
Total: 332 (100%)
The resulting per capita infection rate for each age group is estimated by dividing the infection counts per age group by the population per age group. The result shows the relative risk of infection for each age group:
20-29: 4.09%
30-39: 3.96
40-49: 3.28
50-59: 8.08
60-64: 4.56
65+: 8.17
Total: 4.07%
The relative risk for residents 50 and older appears to be about twice that of younger residents and of the town as a whole. The low risk for the 60-64 age group is mostly like a result of sampling error (these are small numbers for statistical purposes).
The bottom line is that the smallest segments on the published graph in fact represent the largest population-adjusted risk. The 20-49 age group, occupying more than half of the published chart, has the smallest population-adjusted risk.
I encourage the editors to revisit the wisdom of publishing a fundamentally misleading graphic like this — people's lives are at stake.
The thirty year olds usally dont care Its age were your tryen to keep your twenties give up hang ups and tryen to get all you couldnt do before. This allso travel and most have lot people in job work force
Given the extremely small number of residents tested per capita, neither the chart nor the resulting analyses are very informative.
How about a chart showing that precious few residents are wearing masks?